+1 (408) 320-0380
Smart business owners know that successful and reliable revenue forecasting is not only the key strategy for effective sales planning but also one of the main factors that influence the business growth. Though today revenue forecasting is an extremely efficient way both to predict the income of the company and choose the right deals to work on, a lot of sales managers find it difficult to create it. That is just exactly the case when EspoCRM platform comes in handy for your company, as it will help you out of that tangled web of the sales figures.
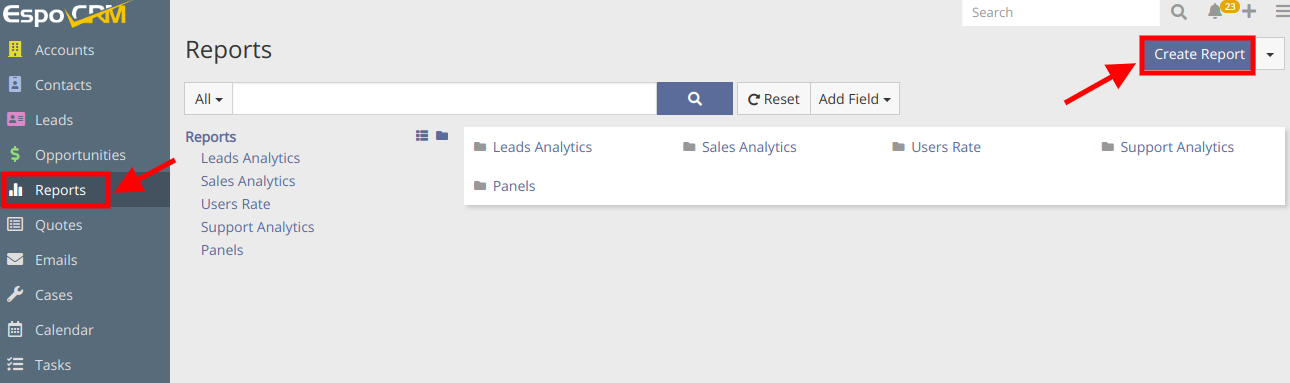
The question is how to start using it? Taking into account the fact that the revenue forecast is based on a special kind of report, the first thing you have to do is to create such kind of report. To create a new report, go to the report tab and press Create Report button.
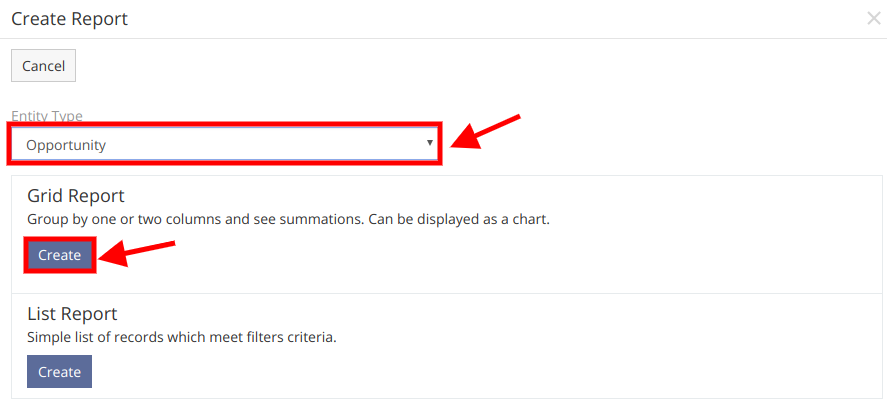
While creating the revenue forecasting reports, the system uses the information about the opportunities, that is why we select Opportunity as the needed Entity Type. The revenue forecasting reports are grid reports, so we choose it and press Create button.
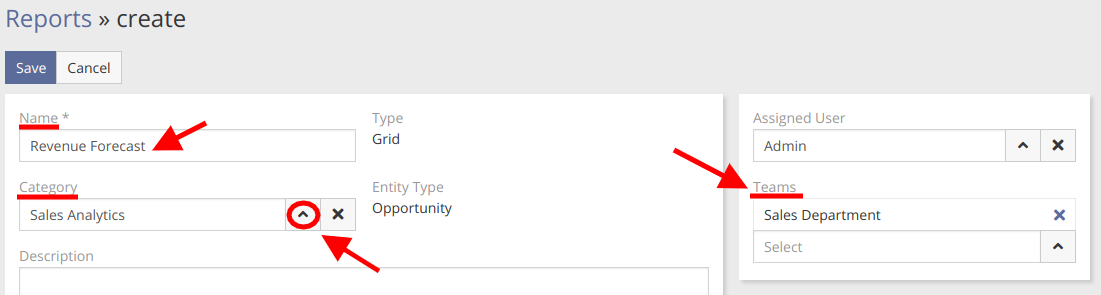
In the next window, we need to set the name of the report. Then we have to choose a category, it’ll be Sales Analytics, and the Team that will be interested in the report is obviously the Sales Department.
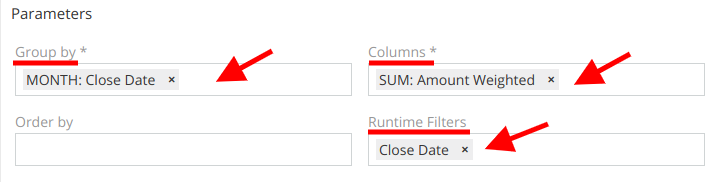
The next stage of creating a revenue forecasting report is setting its parameters (Group by, Columns and Runtime filters). In order to see data about the future amount of your income grouped by month, we suggest you choose the following parameters that are shown in the picture below.
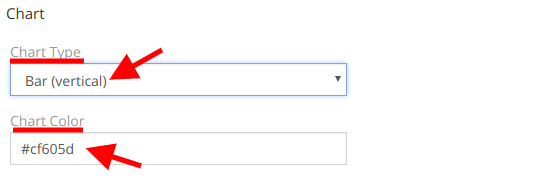
You are also able to choose the chart type, which can be bar vertical, bar horizontal, pie and line, and chart color. When all the chart parameters are set, press the Save button on the top of the page.
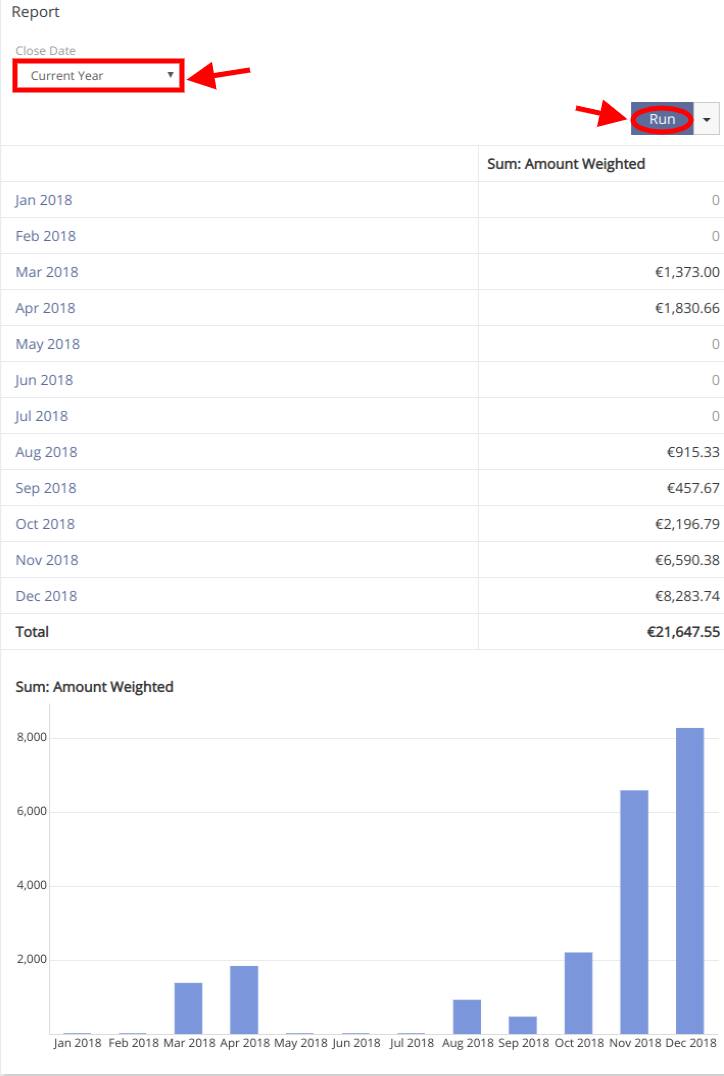
Now, to view the report results, you have only to specify the time period and press the Run button. As you can see, the results are shown both in the table and in the chart.
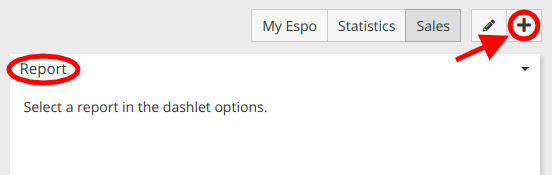
As it might be seen, with revenue forecasting reports your employees to get a comprehensive and detailed view of the sales possibilities which will ensure the rightly-made decisions. But still how to make it more noticed? The best thing is to create the report dashlet on your dashboard. To add a report dashlet, press the plus button and choose the Report from the list, press the add button and it will appear on your dashboard at once.
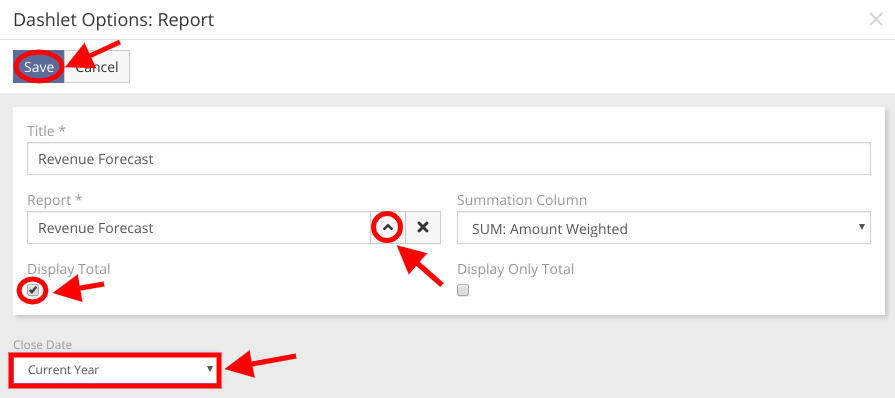
To select the needed report, press the dashlet menu button, choose Options.
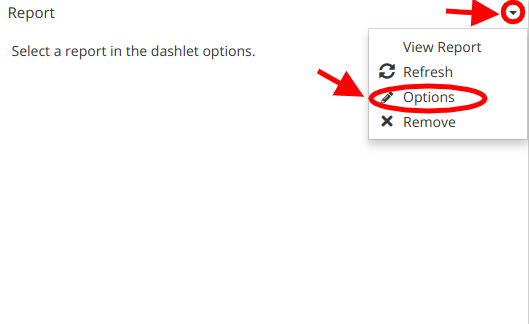
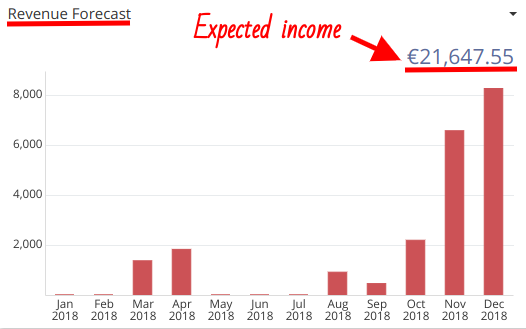
Here you can set the title of the report dashboard, choose the needed report from the list (in our case its Revenue Forecast) and specify the time period. If you check the Display total checkbox, you’ll be able to see the amount of your company’s expected income.
Hope the information was useful for you! Thanks for paying attention!